Web app · metrics · alerts
Bot monitoring
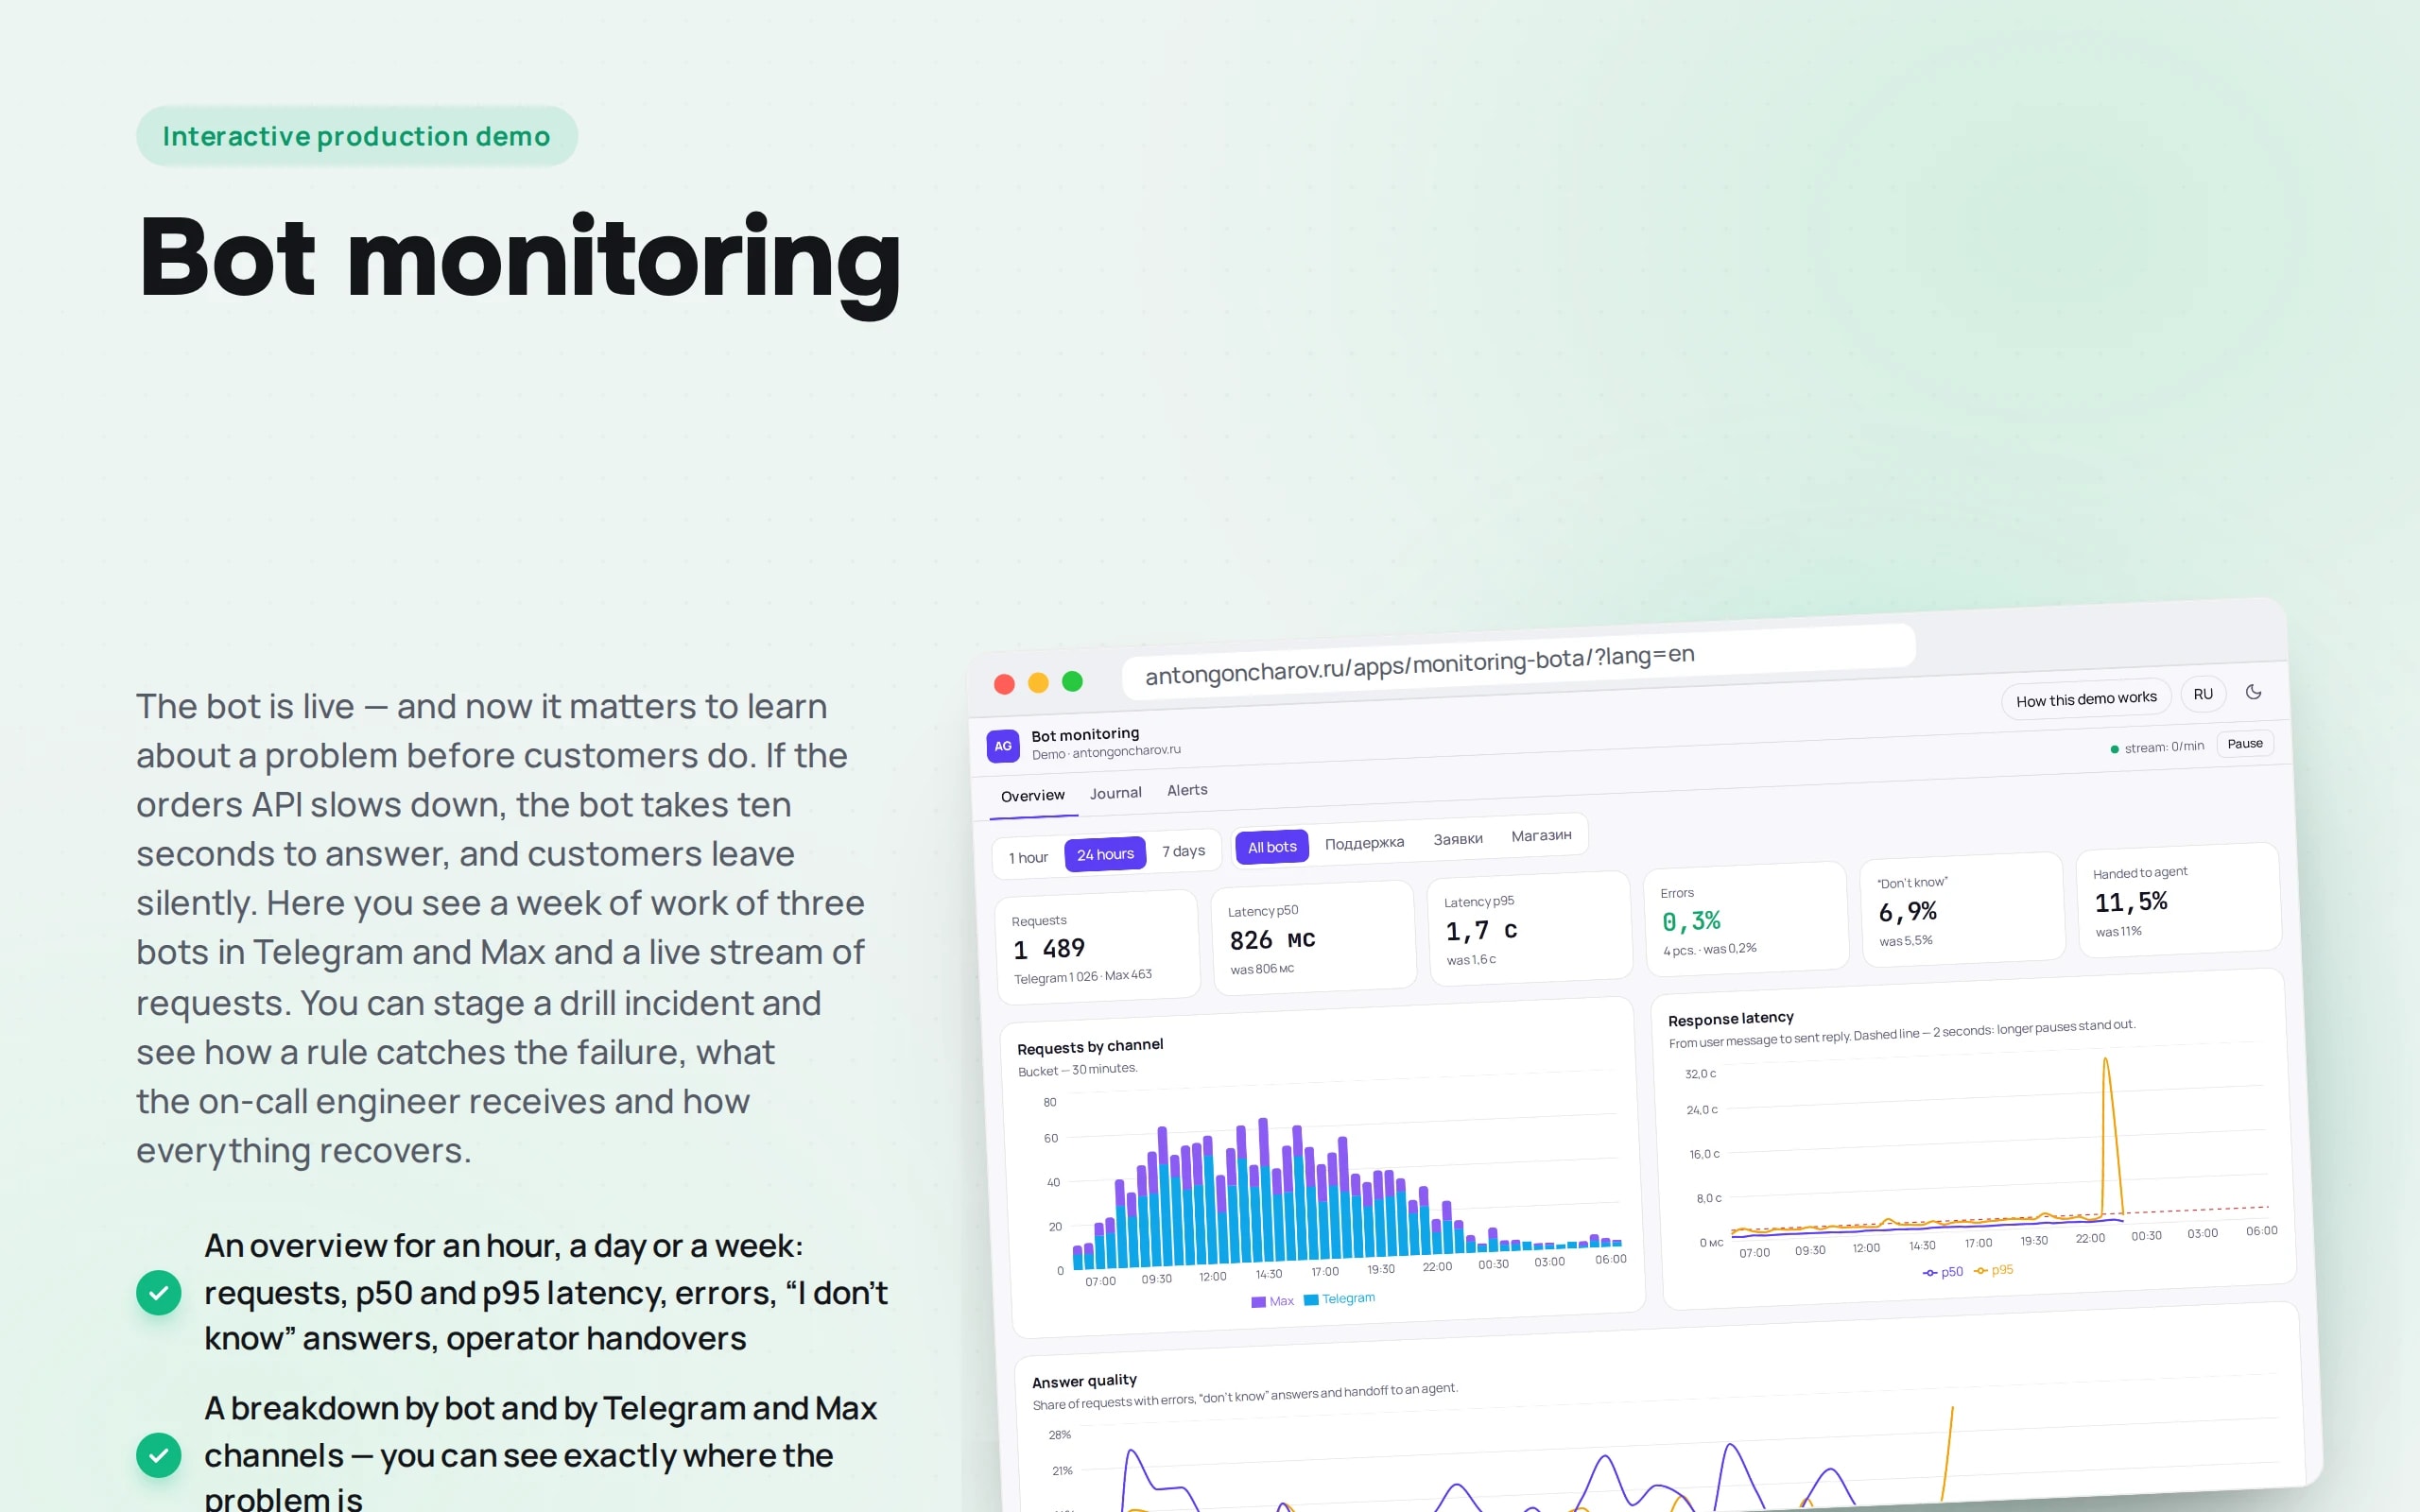
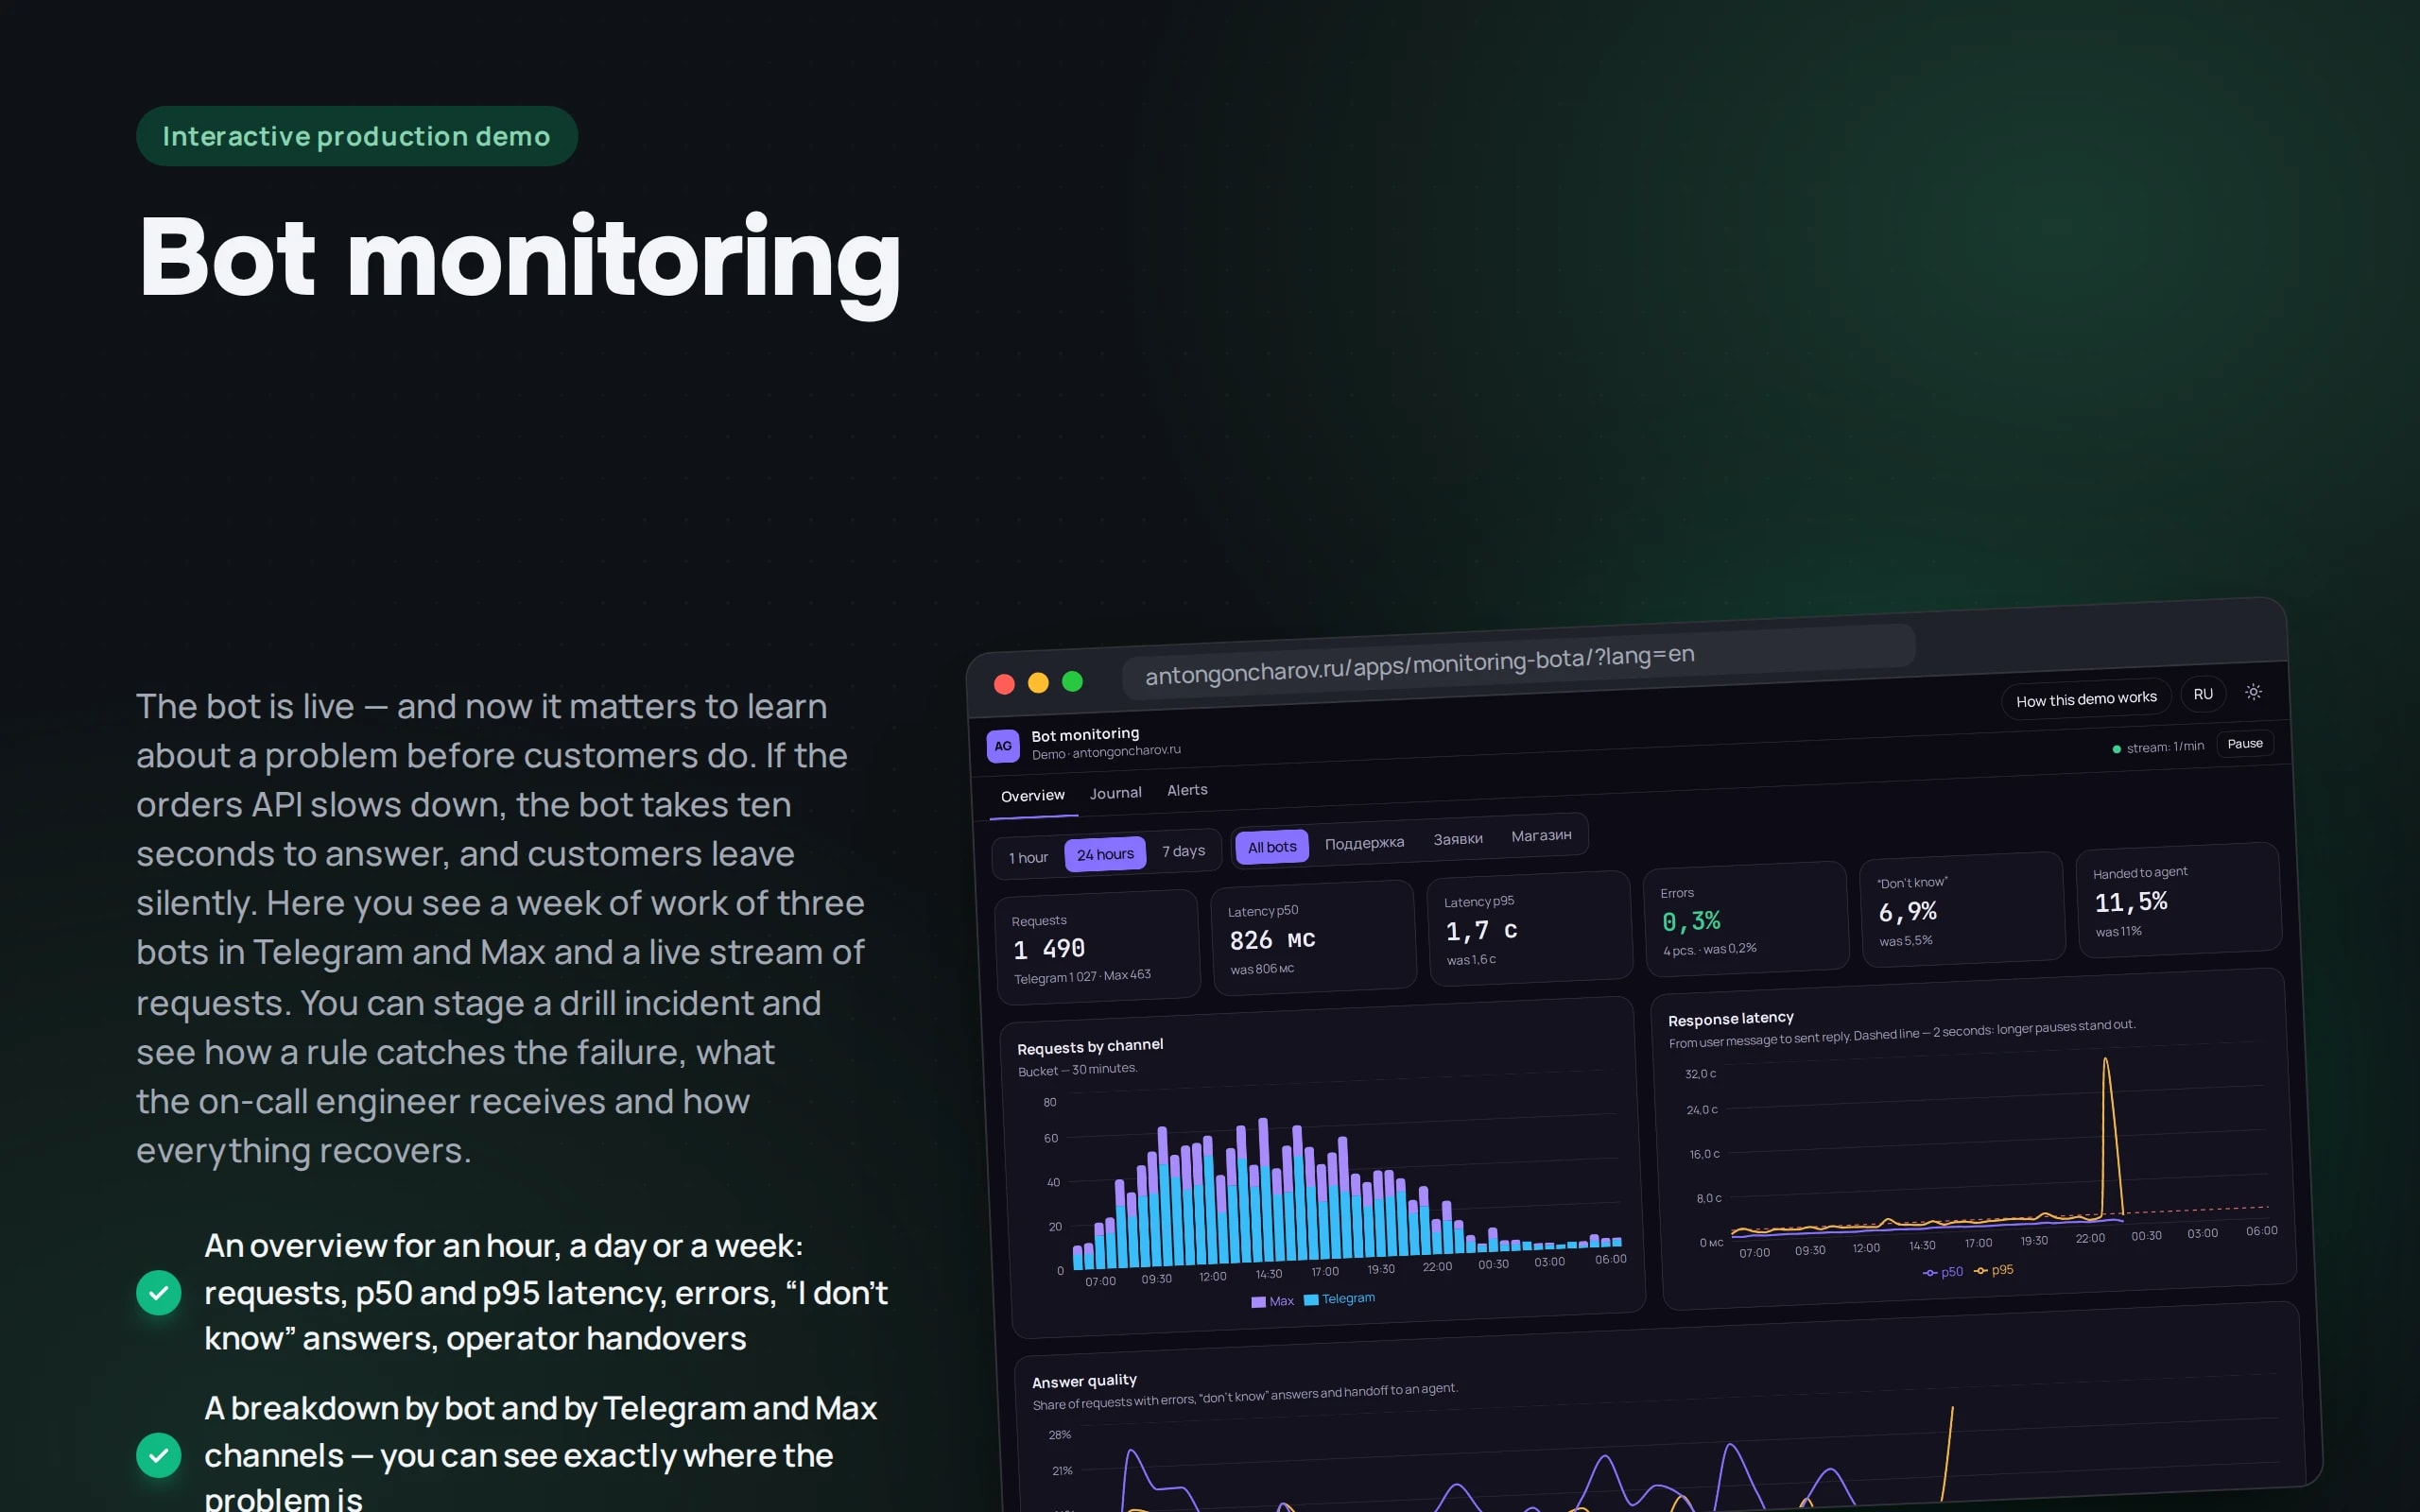
The bot is live — and now it matters to learn about a problem before customers do. If the orders API slows down, the bot takes ten seconds to answer, and customers leave silently. Here you see a week of work of three bots in Telegram and Max and a live stream of requests. You can stage a drill incident and see how a rule catches the failure, what the on-call engineer receives and how everything recovers.
Scenario: Three demo bots: Kvadrat Coworking support, lead intake and a coffee store — in Telegram and Max.
Open the demo
Best on a computer: charts and the log are wider. On a phone the log is shown as cards.
The app runs in your browser: nothing is sent to a server.
What the demo shows
How to try it
Look at the overview
Switch to the week: three days ago there was a Max outage — it shows as a spike on the error chart.
Find a slow request
The “Log” tab, filter “Longer than 2 s” or outcome “Error”. Click a row — the trace opens, showing which step took the time.
Stage an incident
The “Alerts” tab, “Stage an incident”. The “Orders API is slow” rule goes pending, then firing, and a message arrives in the on-call chat.
Fix it
“Fix now” — and the rules return to normal once values drop below the recovery threshold. Thresholds can be changed or a rule disabled.
No paid neural networks
The telemetry is synthetic: a week of history for three demo bots and the live stream are generated in the browser, and the rules work as in Alertmanager: threshold, window, pending period and recovery threshold. In a production project bots write traces to OpenTelemetry, Prometheus collects metrics, rules live in Alertmanager or Grafana, and messages to the on-call engineer go via the Telegram Bot API.
The demo runs without OpenAI, YandexGPT or GigaChat API keys. Wherever a production system calls a model, there’s a local stub with the same interface — so the demo is free, always available and never makes things up.
What a production project adds
- Traces and metrics from the bot’s code: OpenTelemetry, Prometheus, logs in Loki or ClickHouse
- Grafana dashboards by bot, channel and external service
- Telegram alerts with buttons: open the trace, silence, acknowledge
- Separate quality metrics: the share of “I don’t know”, operator handovers and complaints — not just uptime
Stack
- All demos by stack:
- React
- TypeScript
- React 19
- TypeScript
- TanStack Table
- TanStack Virtual
- Recharts
- Zustand
- Vite
Developer’s comment
Anton Goncharov
AI systems developer · Python
For business
- You find out about a problem before your customers: a rule notices the bot is answering slowly and messages the on-call person.
- You see not only “works or not” but also quality: the share of “I don’t know” answers and handovers to an operator.
- Investigating an incident takes minutes: the trace shows which step was slow.
For developers
- The 10,000-request log is TanStack Table with virtualization: only visible rows are rendered.
- Rules work as in Alertmanager: a threshold, a window, a firing delay and a separate recovery threshold so the alert doesn’t flap.
- The trace is a waterfall of steps: input check, search, model, external API, sending. In production OpenTelemetry records them.
Tips
Tip 01
Watch p95, not the average: average latency hides the customers who left.
Tip 02
Set the recovery threshold below the alert threshold, otherwise the rule will flip back and forth at the boundary.
Want the same for your business?
Tell me about your task — I’ll tell you what from the demo fits, how long it will take and what I’ll need from you.
Other demos in this section
All demos- live

Web app · OCR · validating company details
Document recognition
Upload an invoice or a certificate of completion — a photo, scan or PDF. The app recognizes the text, extracts company details and table rows and validates them: tax ID and account checksums, the total and VAT.
- React
- TypeScript
- In-browser neural network
- live

Web app · conversations · deals · analytics
Operator panel
The workspace of an operator who receives difficult requests from a bot: a queue with a timer, a conversation summary, a reply draft, deals on a kanban board and analytics — on a live stream of customers.
- React
- TypeScript
- live

Web app · Recharts · RBAC · audit
SaaS dashboard
A SaaS revenue team’s workspace: MRR by plan, revenue movement, churn, customer health, CSV export for Excel and an activity log. All numbers are calculated from a single year of history — changing a plan in a customer card moves MRR on the charts immediately.
- React
- TypeScript
- live

Web app · Laravel · PostgreSQL
Warehouse system on Laravel
Warehouse accounting where stock is the sum of ledger entries, not a “qty--” field: orders with all-or-nothing reservation, picking by bin, receiving with CSV import, stocktaking and a ledger. A race between two real PHP processes in PostgreSQL shows why row locking is needed.
- PHP
- live

Python scraper · runs in the browser
Competitor price monitoring
A Python scraper crawls the websites of three competitors of an electronics store every day: an HTML catalog with pagination, a sitemap with JSON-LD and an SPA with an API. It matches products with the catalog, sends notifications about changes, recommends a price by rules and exports a report to Excel. Python runs right in the browser.
- Python
- React
- TypeScript
- live

Web app · PWA · vanilla JS
Offline courier app
A courier’s working day: orders, a call to the customer, handover with a photo and signature. The app opens and works without a network, and changes go to dispatch when the connection returns. If the dispatcher changed the same order in the meantime, the courier chooses which version is right.
- Vanilla JS